

You must log in or register to comment.
What’s the source for this image?
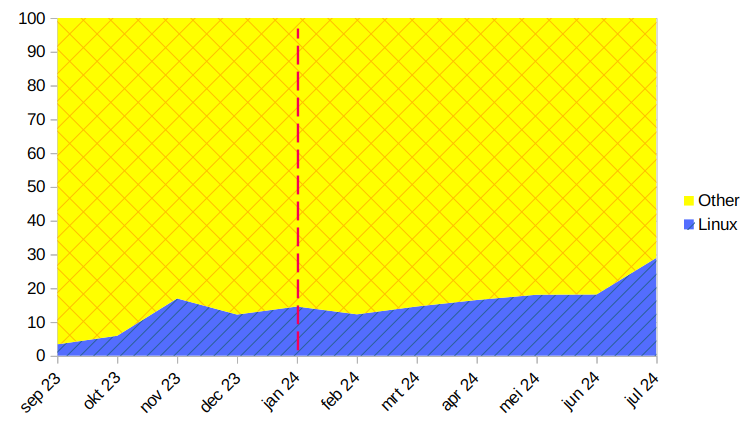
I downloaded the data from globalstats statscounter
How do you make the graph? What type of graph is it?
So I can use it for browser marketshare and search engine marketshare.
You can download the .csv data from the website. Then make a stacked area chart in something like Excel/Google Sheets/Libreoffice Calc.