Hi Guiseppe
How do you check what is eating up all your memory/cpu?
Ah, I see. I use htop as a task manager.
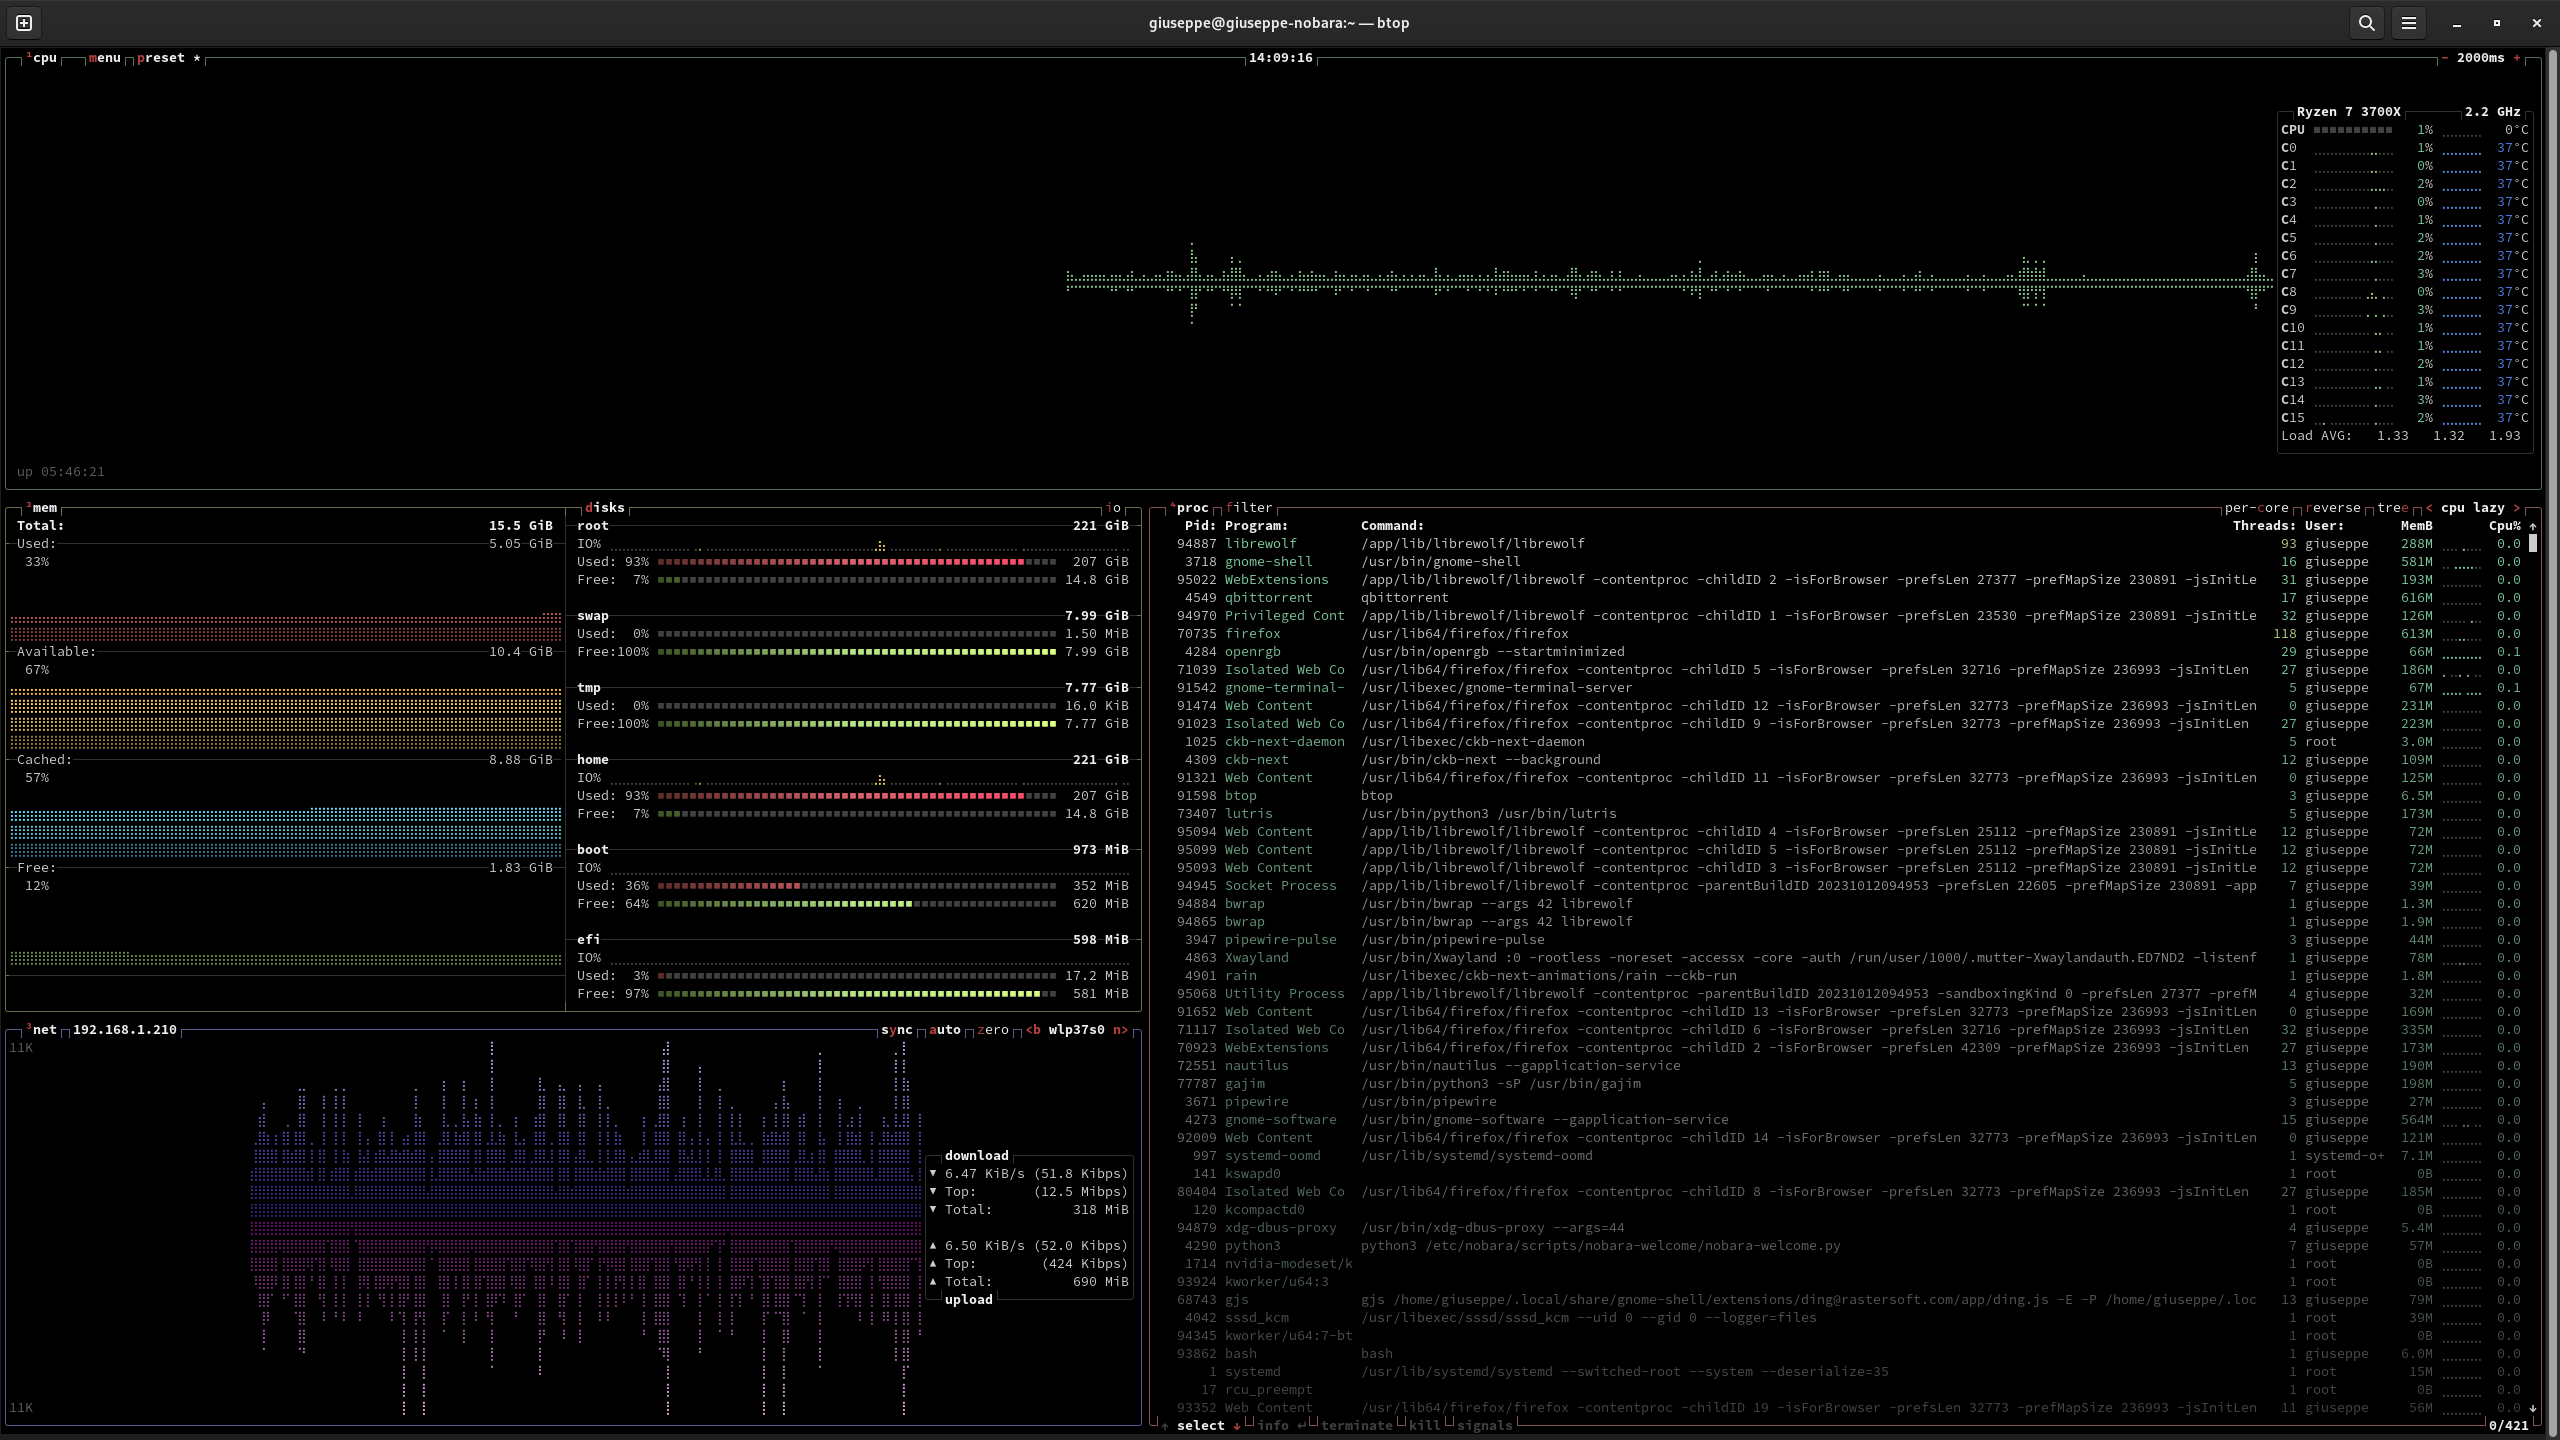
To get a comprehensive overview of your system’s resource usage, install and run the
btopcommand. It’s a top-like interactive system monitor that displays a range of system information, including:-CPU usage (per core and overall)
-RAM usage (free, used, and cached)
-Disk usage (per disk and overall)
-Network usage (bytes sent and received)
-Process list (with CPU, RAM, and disk usage per process)
-System temperature
-Uptimemount google drive as swap. RAM downloaded !!
https://blog.horner.tj/how-to-kinda-download-more-ram/
Already been done.
⬆️ This man is too dangerous to be left alive.
There’s a top surgery joke in here somewhere, I can feel it.
Switch to a different virtual terminal (ctrl-alt-F3), login and restart desktop manager, switch back to the normal GUI terminal (ctrl-alt-F2)
You can try the Magic SysRq key, if its enabled.
It’s very attractive, but it also seems to have a minimum window size requirement that exceeds the “stack” in my “master and stack.”
It’s great to use if you need a dashboard to track issues, but for a quick look at running processes, I think I’ll stick with htop.
btop doesn’t update all of the characters for me after a while if I leave it open for a long time, and eventually it stops updating altogether.
deleted by creator
Ooh, it looks even better than gtop.
Edit: Why does the menu look like this?

Nostalgia city…
50/50 on if it starts listing processes or launches a new game of Zelda.
Uh oh, time to rewrite it in rust
deleted by creator
The rust one is called bottom (btm) see the other thread :). When you already have a rust environment it is just at a cargo install away which is convenient.
Jeez, never saw that, mine just open the program
Press ‘m’
Yeah, that looks very cool. Wish I could use it as my wallpaper or a widget in gnome
Open btop in the terminal, then (note the terminal window must not be in fullscreen) right click with the mouse on the top bar of the terminal window and select “Always on top”.
Bottom for life (or at least until something with more stats comes out)
it’s a good language
The graphs look way better than btop.
I agree here, although I have no clue why it looks so different.
@Static_Rocket @zShxck for a second there I thought he was revealing his favored sexual positions
it’s actually really pretty
I’m really loving bottom
Switch is that perfect sweet spot right in the middle. Very versatile.
Just found this too, through the rust post some days ago…but its quite obvious that from a usability context that btop is easier to use. With bottom you have to memorize all hotkeys wheres btop is showing them right in the interface.
Yea. I was using bottom until I saw this and did a quick side-by-side comparison (
nix-shell -p btop, I use NixOS BTW). btop’s UI is just so much better.
@JoMiran @zShxck That is very nice. I love the way you can toggle between disk space usage and disk I/O usage. Here is a btop of the machine that friendica.eskimo.com is running on:
I made the swich a year or two ago. It is much better I find. I leave it running in a tmux session on my server . with btop on one pane and switch to another with a split view to do work. It allows me to take a quick glance at any time while not taking the focus from what I was working on.
Don’t understand why someone should downvote you, take my upvote instead
Might be missclick. Some people have fat fingers.
The slide is what gets me. My client supports swiping for voting so I’m constantly downvoting by accident.
So does mine (Voyager), and the misswipes is why I disabled it, which thankfully Voyagers allows to be configurable.
The latest Voyager also allows you to customize when the long swipe trigger point is now! Settings -> Gestures -> Long Swipe Trigger Point
I saw him with “-1” so actually 2 people not just one person have misclicked according to your theory. Hmmm i don’t know, but i hope it’s true, better then the alternative
Lol no idea, some people just want to watch the world burn I suppose. Thanks kind stranger. Wishing you and yours the best.
has more empty space. Can the user change that?
You can collapse the subwindows and configure the graphs
Oh, good.
Meanwhile, every system (even Android) has good ol’ top. It works.
It can’t even kill processes.
That’s what kill is for …
And then I forget the pid.
That’s what pkill is for.
It should be in the terminal right next to the one you have open for issuing the kill command
Don’t tell me that you’re only using a single terminal window
Nice, I’ve tried gtop and atop before and they were pretty nice, but I usually fall back to htop because old habits die hard. I’ll give this a go!
Can it show each core’s frequency? Or is there anything other than htop that can do that?
It does
I don’t see any option in 1.2.13, and https://github.com/aristocratos/btop/issues/190 suggests it isn’t implemented yet.
True, i confused it with clock frequency.
This looks great! Thanks for the recommendation.
I like Netdata because it’s web based, has a large number of metrics, you can pan/zoom the graphs, and it doesn’t use much CPU power. Console UIs are nice but they’re more limiting than something web-based.
Perhaps someone can implement something w3mimage or sixels in btop for pannable graphs. Don’t know how efficient that is.